Datascapes & the Informal City (Fall 2014)
During the Fall 2014 semester, Datascapes & the Informal City was a Special Topics Seminar offered at the Barnard + Columbia Colleges Architecture Department, building upon the work produced the previous school year. The seminar asked questions on urban informality combining methods of spatial analysis, data collection and criticism, visualization and representation, and interactivity via web-based mapping. (The Fall 2013 seminar explored the same questions through 3D printing.)

(Click image to see the Course Website, including interactive map visualizations, at barnard.edu.)
The Course
For the course’s purposes, the ‘informal’ was defined as the typically undocumented processes and relationships within the city which are often predicated on perception, on tradition, or on social behaviors that either are not or cannot be easily recorded through the standard means of data collection. Often these include topics for which quantitative metrics or otherwise reliable survey instruments fail, those for which the most affected populations are systematically excluded through sampling biases, those for which ecological fallacies corrupt statistical results, as well as those which simply change faster than information is gathered.
In many ways, the course sought to test the extent to which we may understand and describe what we cannot readily sense in a dynamic and complex system as the interaction between the layers of information we can quickly access. As such, these informal urban processes were modeled as the resultant spatial relationships between analyzed datasets either publically available or created through field work.
Through project-based learning, students engaged topics and skills that are often taught separately, synthesizing theory with practice and the development of critical hypotheses with the design of rigorous methodologies. The final deliverables function not only as the product of their endeavors, but as communicative objects for the discussion of urban issues often difficult to describe, as further evidence that no singular dataset may sufficiently describe complex conditions, and as proof of concept for currently evolving techniques of analysis and design. This multifaceted and situated approach to teaching and to social systems inquiry has become invaluable at a time when urban informatics is ever-growing, quality data is more widely available than ever, and yet social landscapes change faster than at any time before, and crucial questions remain either unanswered or unasked.
Thus, seminar asks a series of questions currently on the minds of researchers and practitioners in the fields of architecture and urbanism, while recognizing that the course would likely generate more questions than it answers. Among those initial questions were
What is and could be the role of spatial data visualization in architectural design and urban decision making, generally?
The course examined the applications of data visualization and mapping in architectural research and design practices, and students surveyed and critiqued existing examples of both static image maps and online interactive maps.To what extent can data visualization be used to understand or gain insight into the subjective experiences and informal processes of urban life?
The specific challenge of the projects presented here tasked the students with considering urban phenomena that ultimately cannot be quantified or summarily described through the analysis of numeric data. As such, these informal practices are often left unrepresented in decision making models and methods reliant upon emerging techniques of data visualization despite their importance in the functioning of the city. In response, the students developed visualization projects aimed at describing, investigating, and/or revealing these practices through thoughtful design, creative analysis, and careful consideration of the interactions between collected datasets and between the visualization and its audience.How do representational conventions influence the communicative and analytical efficacy of mapped data? Specifically, what are the conventions of web-based mapping and how might they be challenged so as to use interactive maps as tools for research and discourse?
Building on the previous inquiries, students collectively tackled this question through their design explorations. Some introduced temporality into the interactive experience, while others exploited the ability to “zoom in” on the map to consider the resolution of a dataset against the scale of the drawing or to put forth thematic comparisons between layers of information.
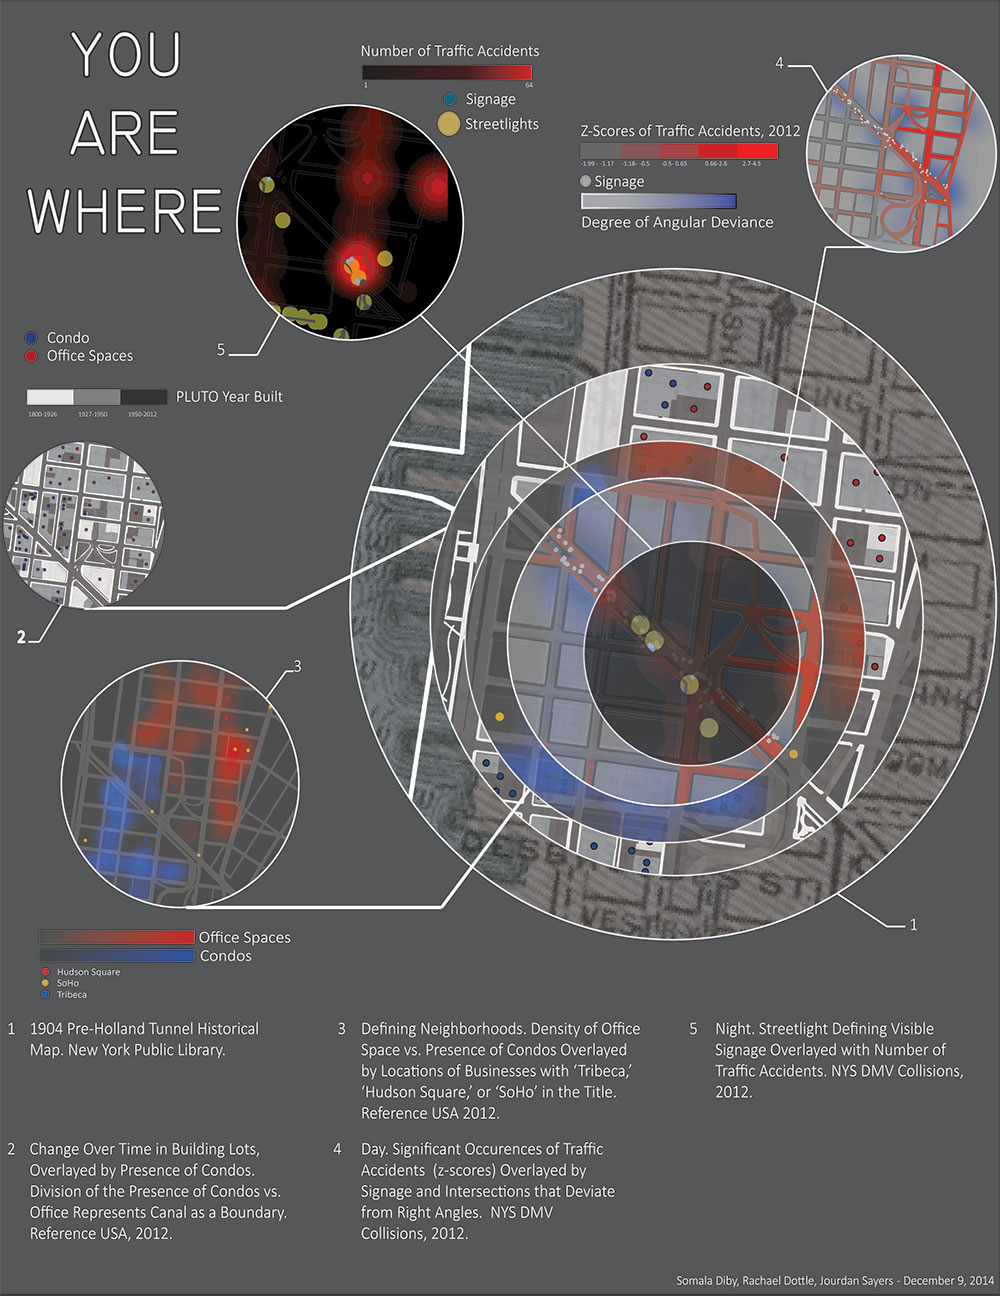
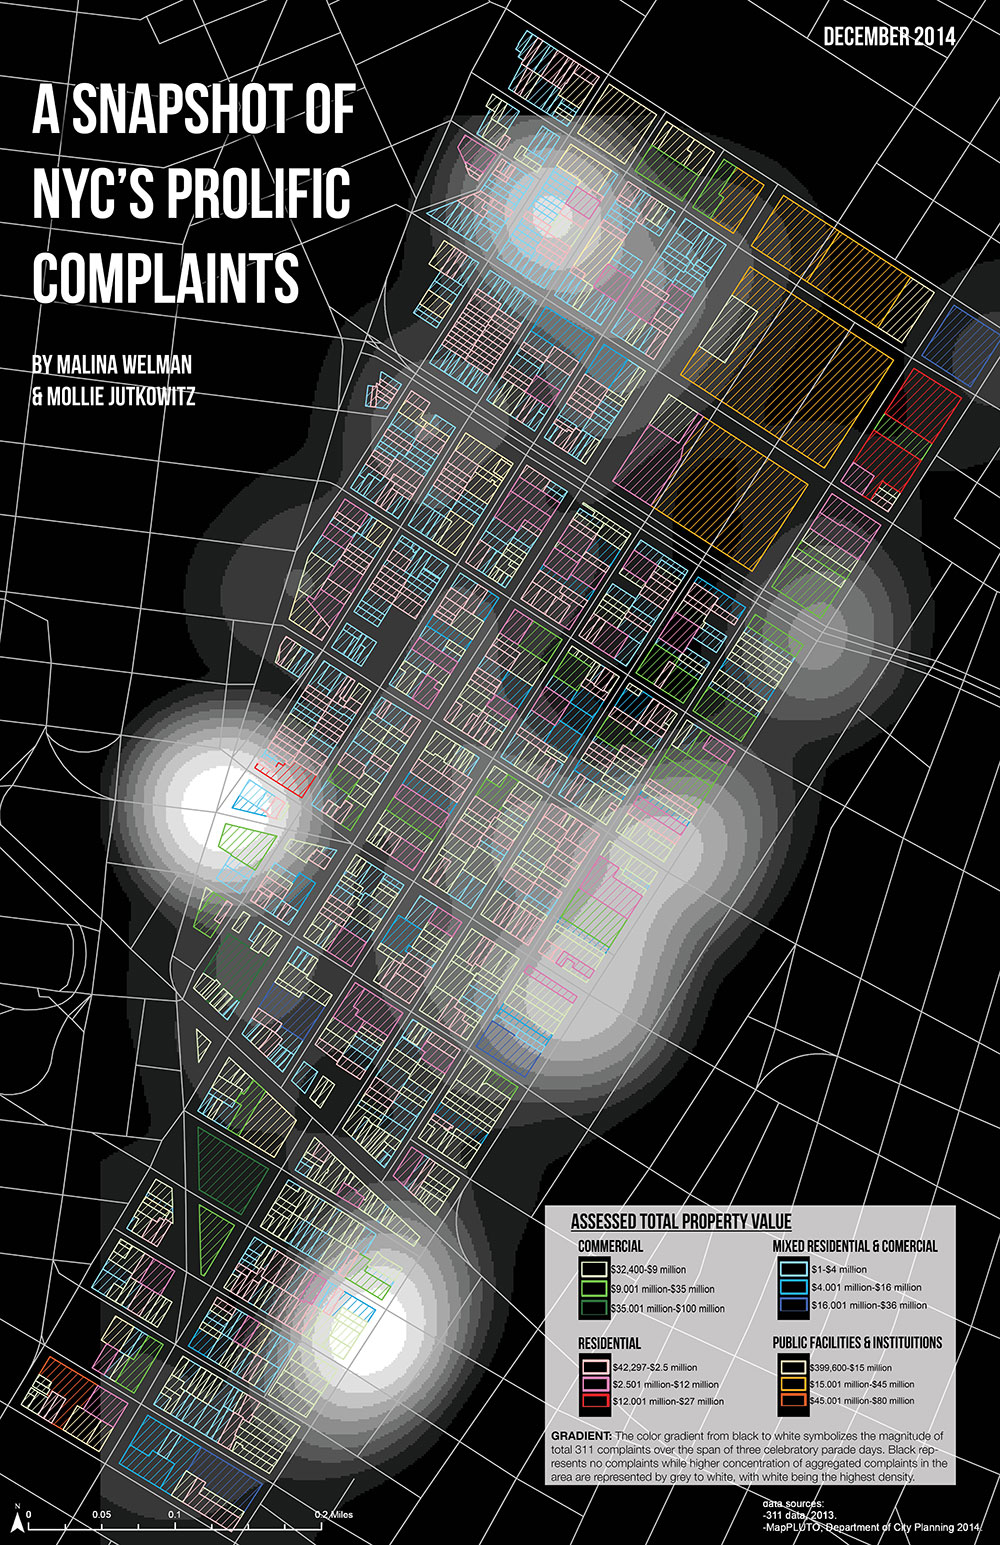
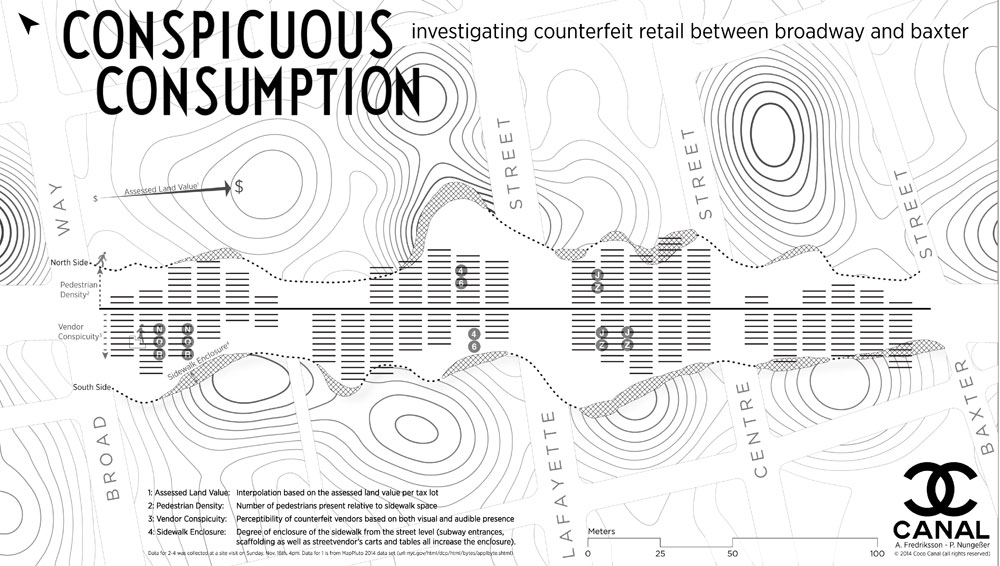
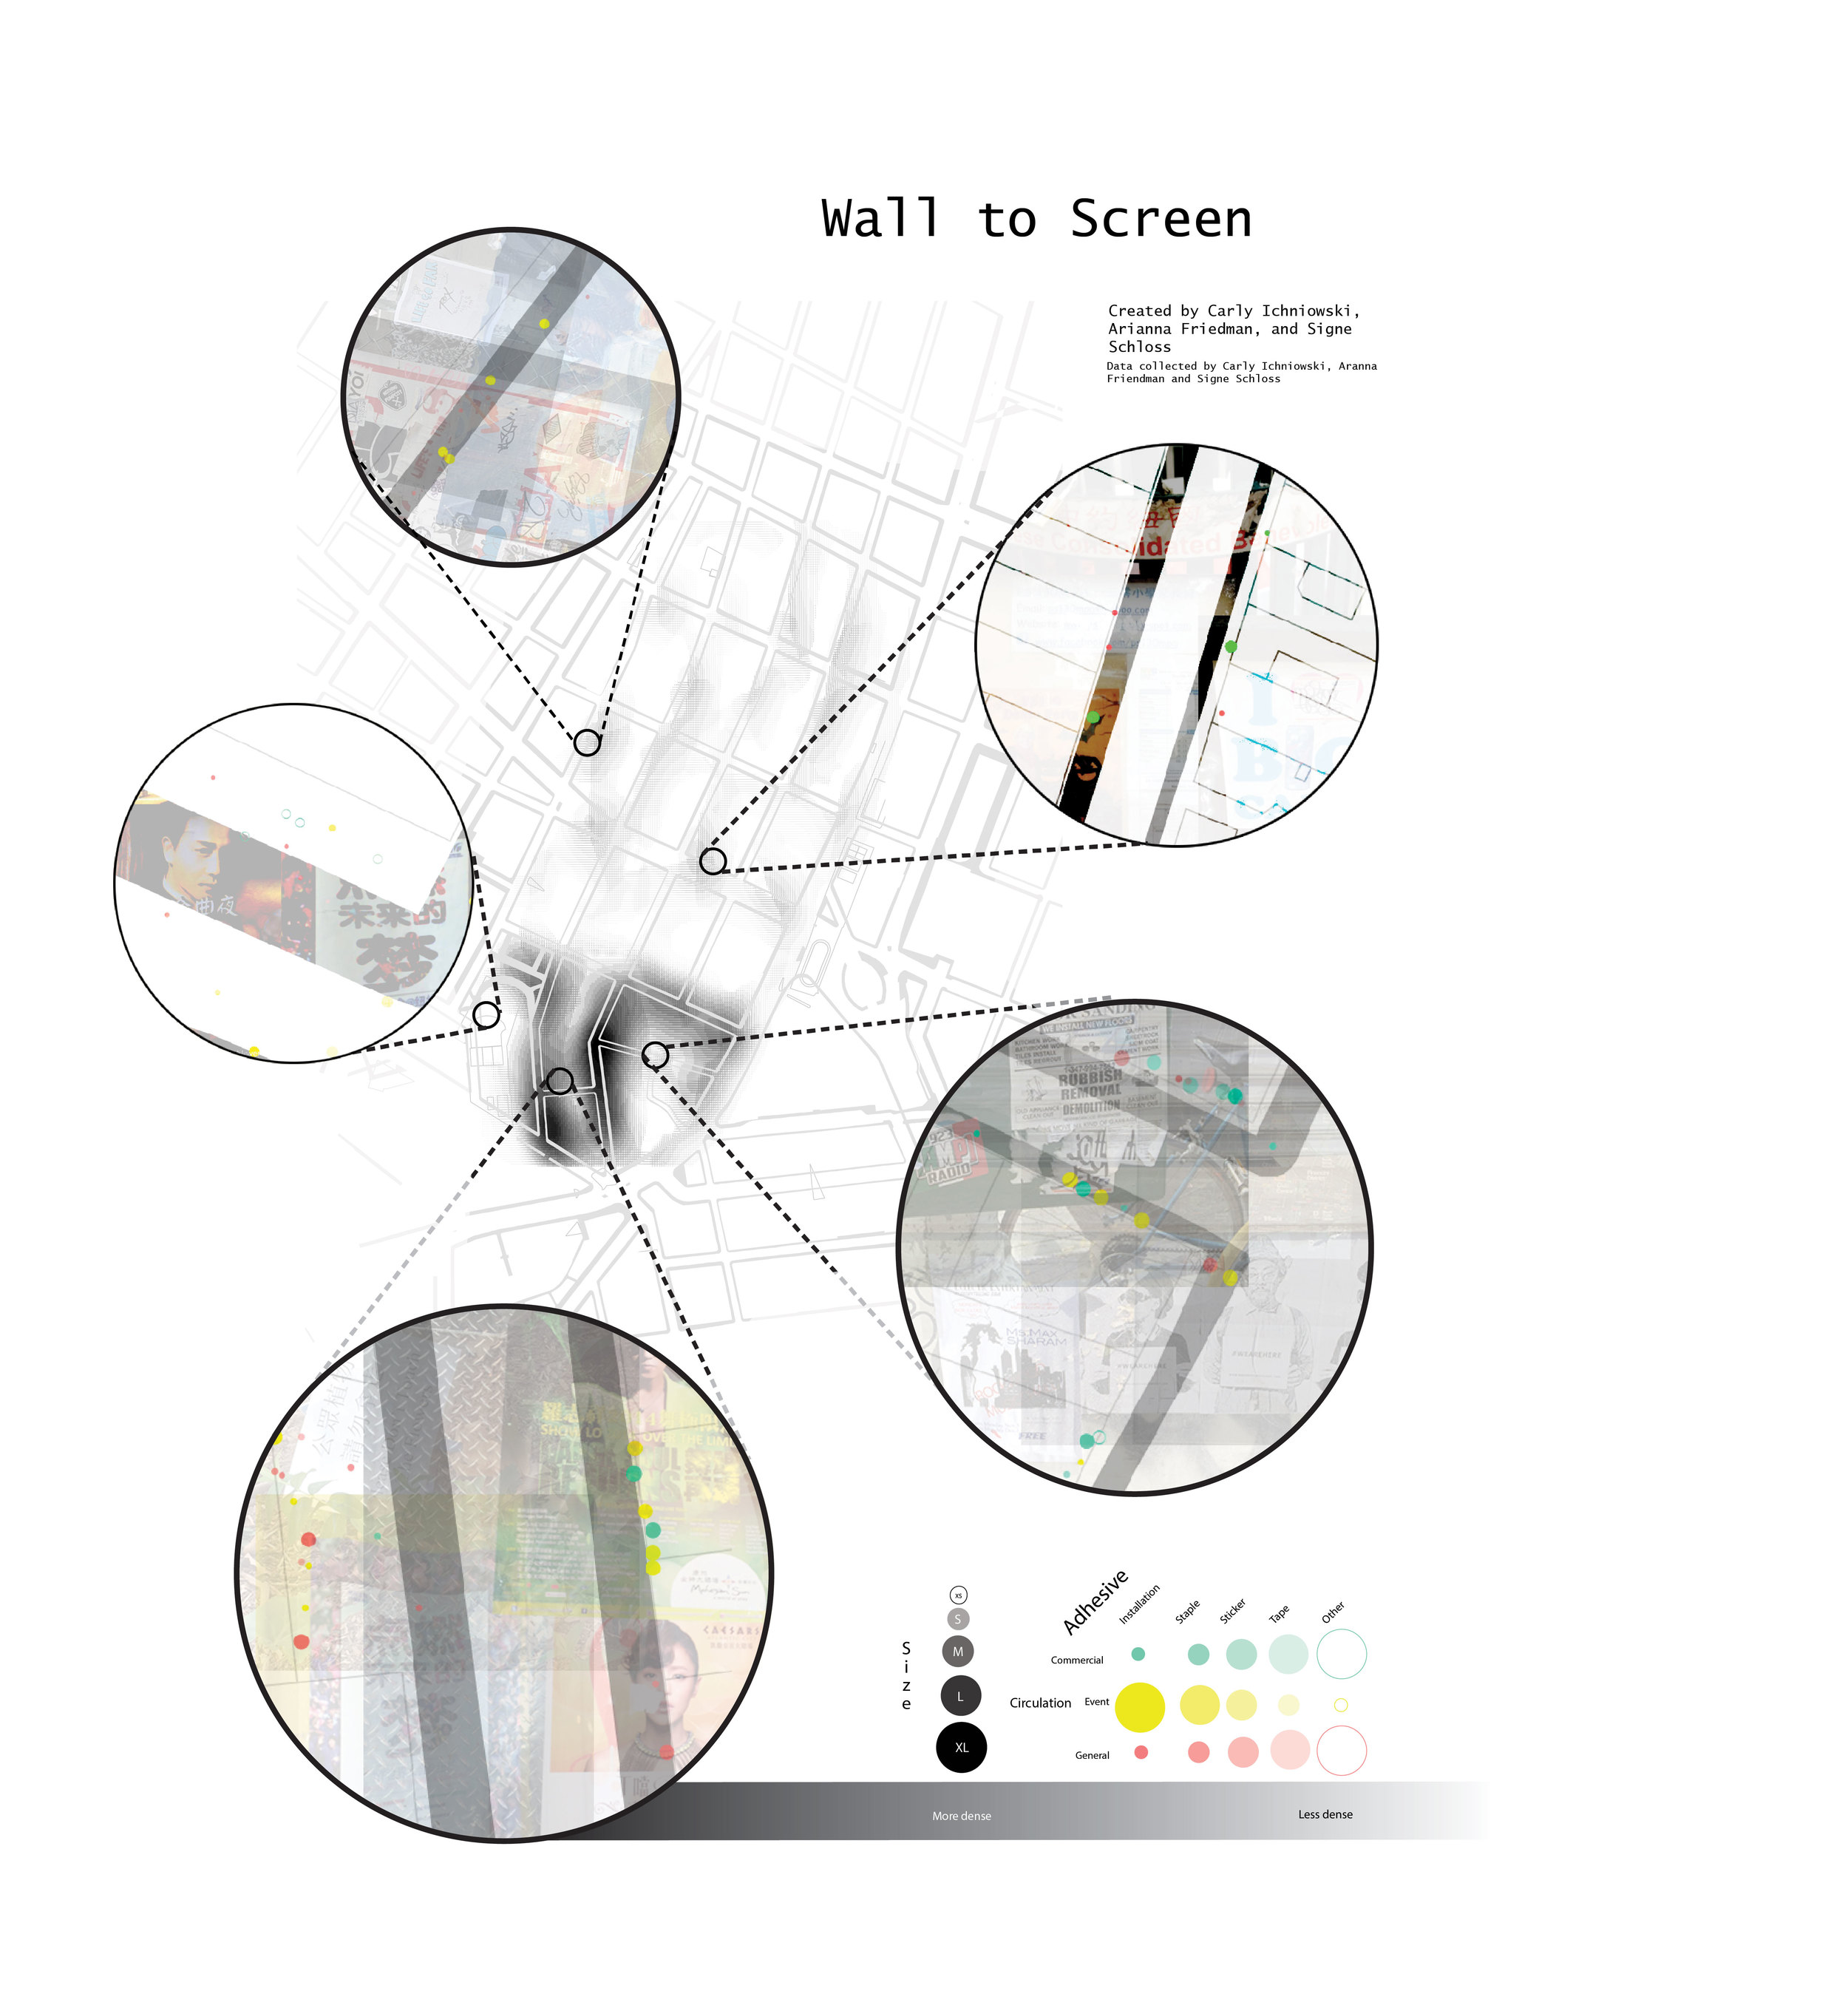
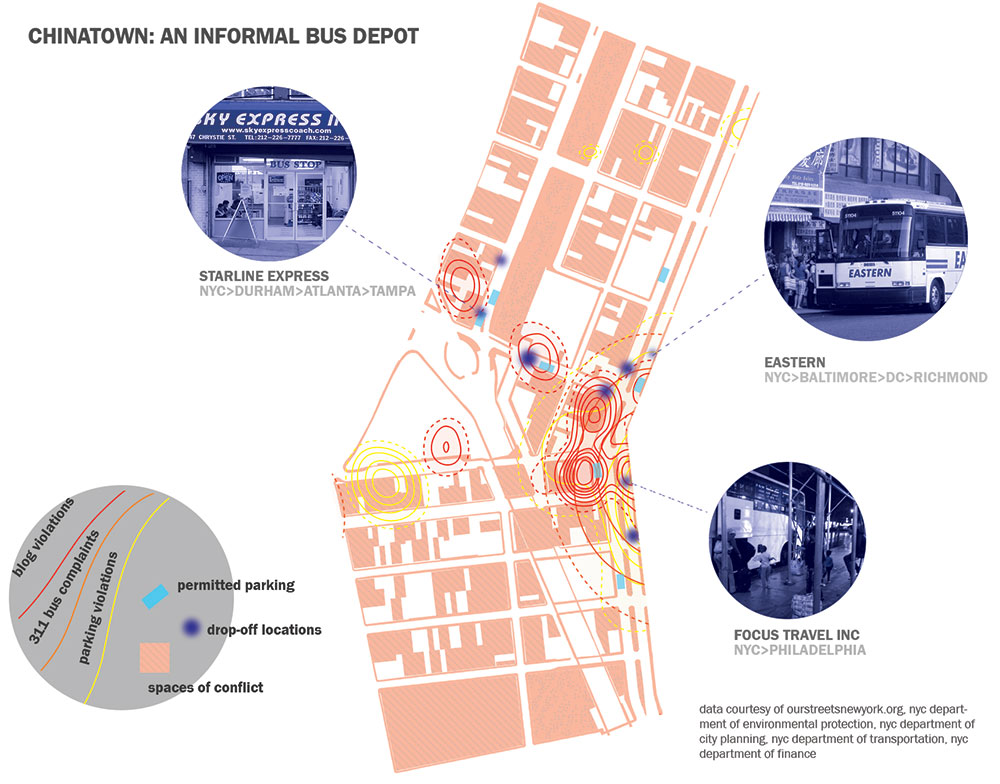
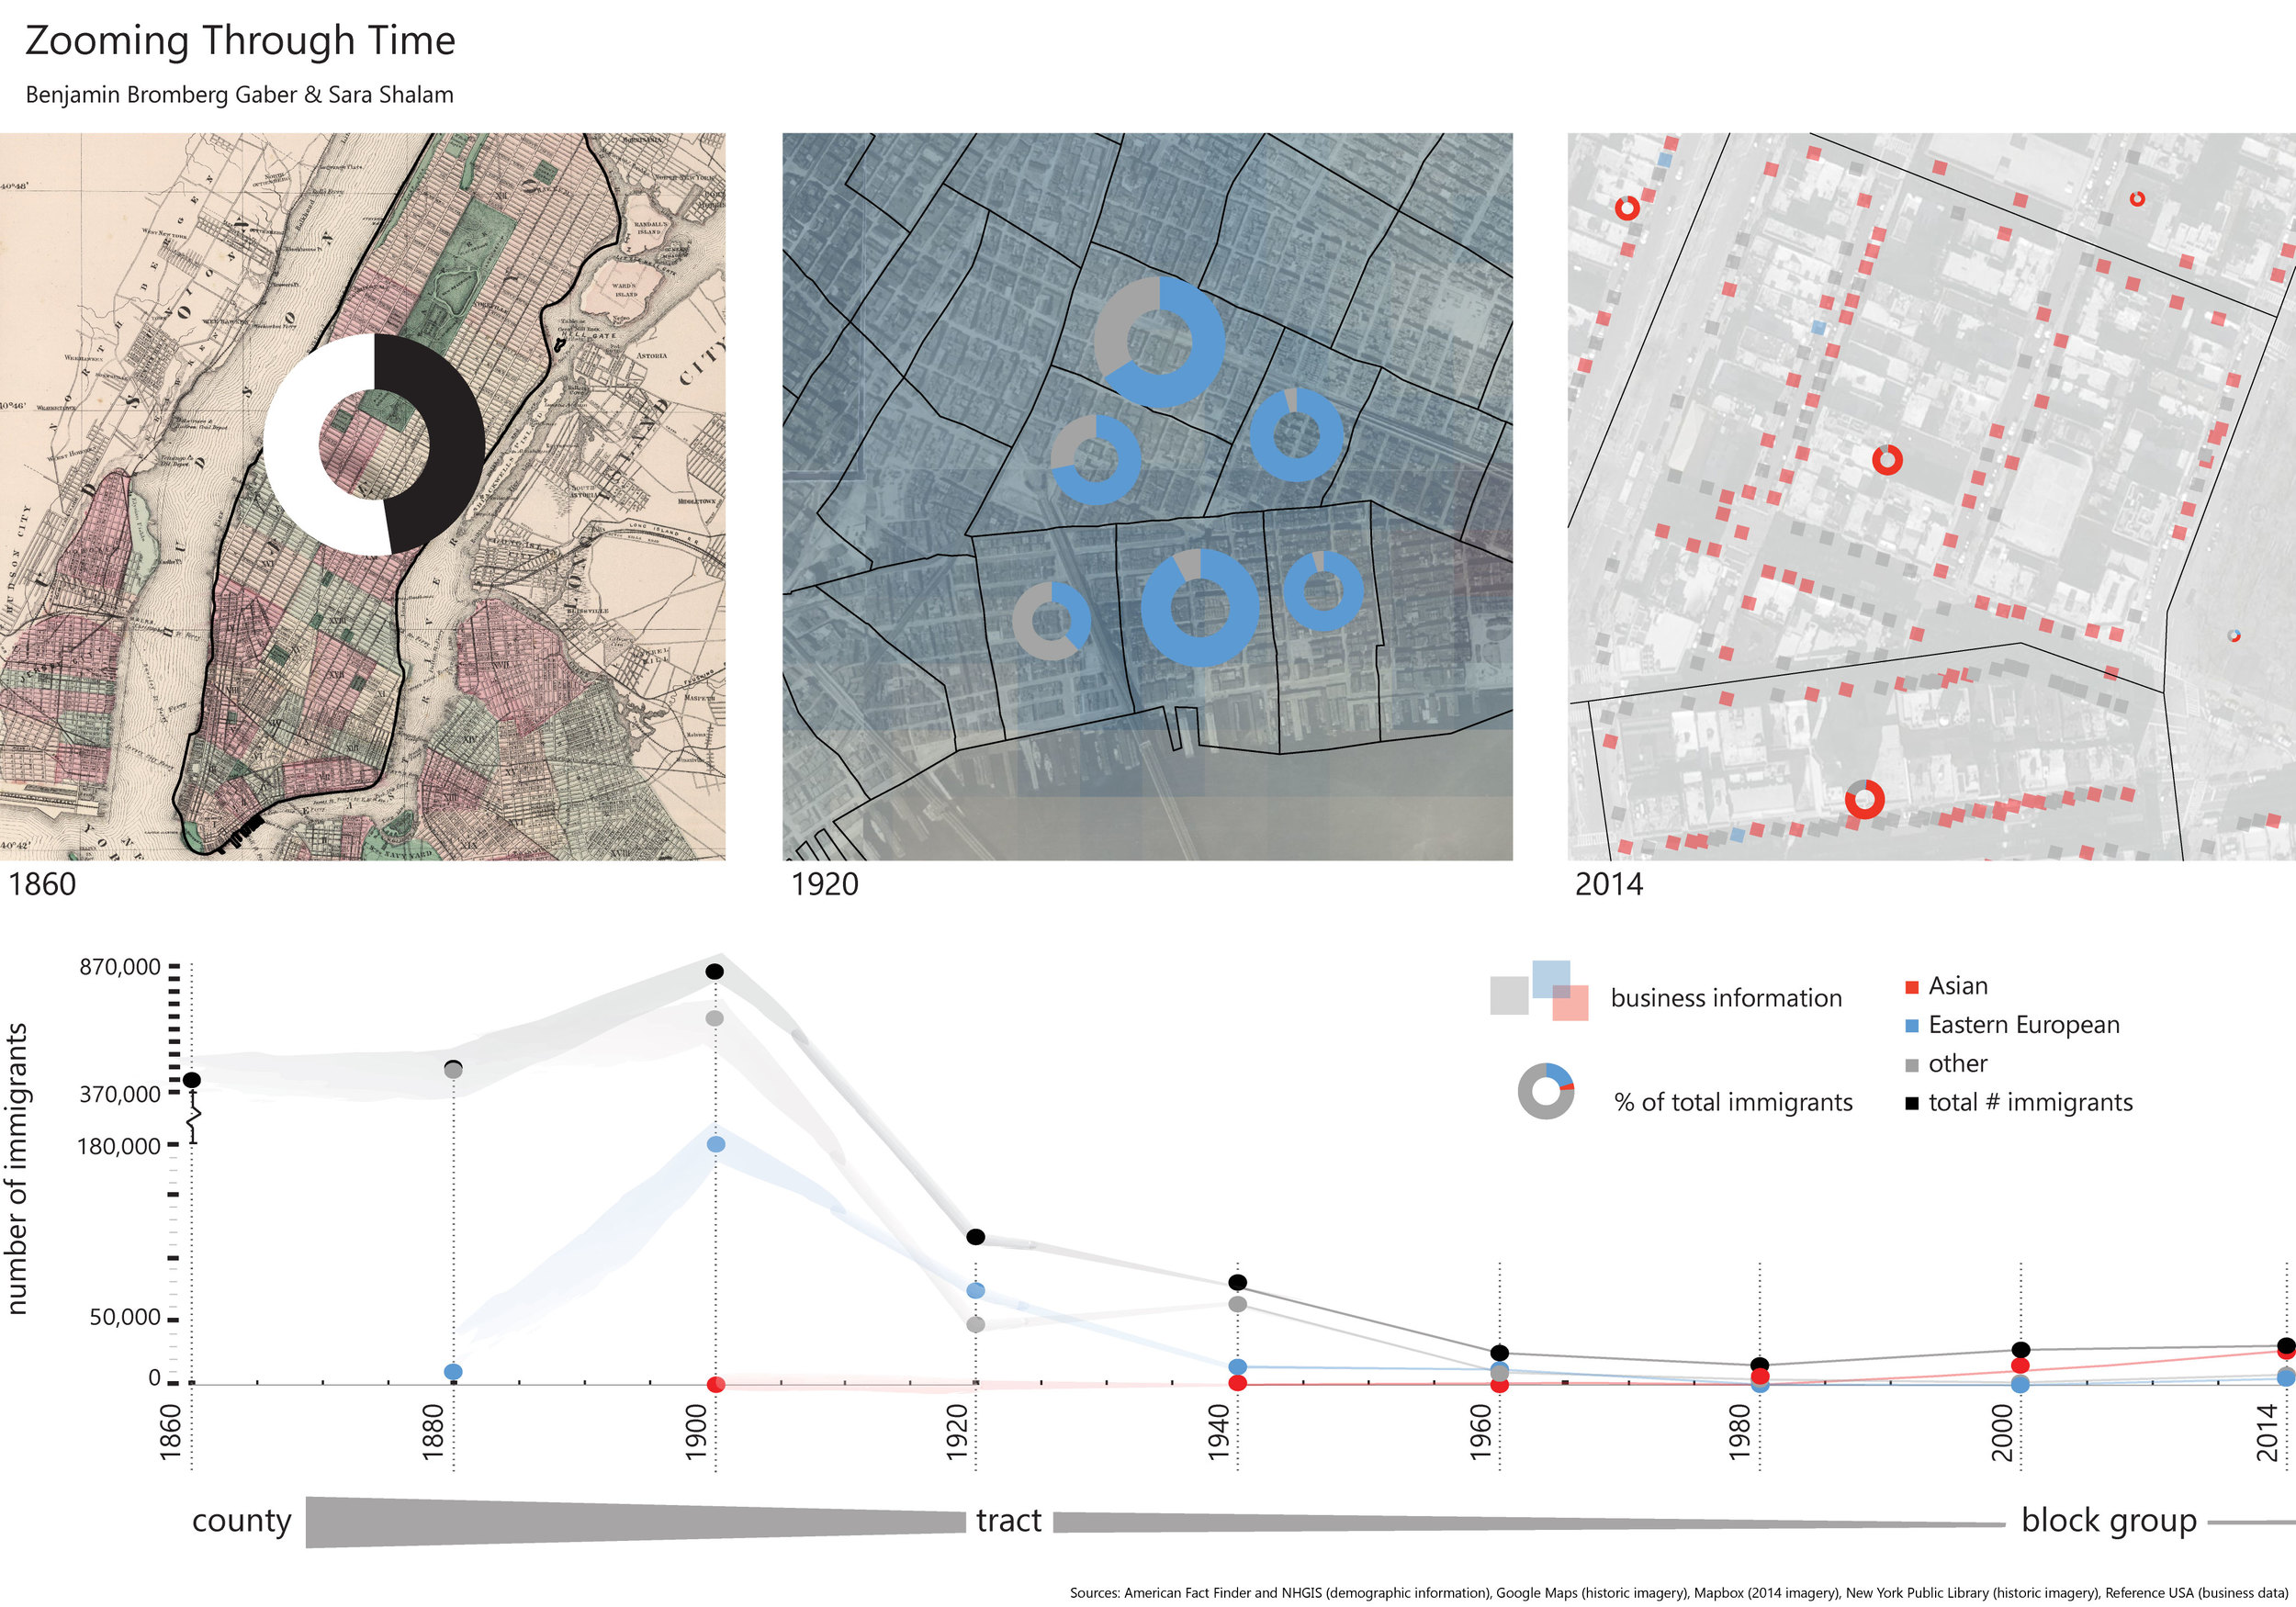
The students worked in groups on six separate, but adjacent and sometimes overlapping, sites along Manhattan’s Canal Street. This distinct-but-connected corridor approach allowed for a seminar-wide conversation, the ability to share data resources while comparing the many different ways singular datasets can be analyzed and visualized, while affording the opportunity for the projects to diverge as necessary.
This divergence between the projects ultimately underscores a working premise of the course and a repeated point in the seminar discussion: that data-driven design is not synonymous with mathematical conclusion or derivation -- that design is a human decision-making process, whether the design of research methodologies, of visualization tools, or of the built and policy interventions that result. From the syllabus:
To design without data is to ignore what could be known, but to design with data is neither simple nor agnostic. Understanding and contextualizing the datasets that proliferate [in cities] is not a straightforward matter of number-crunching, but rather a design process in its own right. A “raw,” “unbiased,” or “pure” dataset does not exist, and the analysis of any dataset requires assumption and ultimately asks the analyst for his or her personal judgment. Further, designing based on the results of data-driven analysis does not relieve the designer of his or her opinions, beliefs, politics, or theses. More than ever, our decisions may be grounded in information, but they are our decisions nonetheless.
The images above include only some of the final deliverables. The course's work, which includes interactive map visualizations, is collected and presented here. That site, I think, speaks volumes to the seriousness with which today’s students are engaging the implications (ethical and otherwise) of “smart cities,” ubiquitous sensing, and urban informatics more generally. Theirs is not the generation pioneering the urban “turn toward data,” but the one that will be determining its value.
Acknowledgements & Credits
Thanks so much to Columbia's DSSC and Barnard's ERL and IMATS. Additionally, Mayo Nissen and Juan Saldarriaga offered inspiration and motivation through their guest lectures. As always, I owe considerable thanks to the students who embark on these uncharted journeys with me.
Related
Previous course: Datascapes & the Informal City (2013)
"Challenging the City & Its Data," [video link] a talk on pedagogical approaches to data visualization and pluralism in cities. Presenting Datascapes & The Informal City at Reading the City: Multilingualism, Multiculturalism, and Urban Landscapes, a symposium convened by the Columbia University Language Research Center. (May 2015)
The syllabus describes that spatial data visualization has become a favorite activity within architecture, both as a tool for analysis and as a medium for representation. And while these two uses—analysis and representation—are intimately linked in all disciplines, they are often almost synonymous in architecture. Spatial analysis and the understanding of spatial relationships—social relations within the city, organizational mechanisms and patterns, interaction between users and environments, descriptions of communities—all of these are understood via the drawing, the map, the diagram, the plan. Thus, the ways in which we draw the city, including the data we declare representative and how we choose to represent it, has profound effects on what we know of the city.