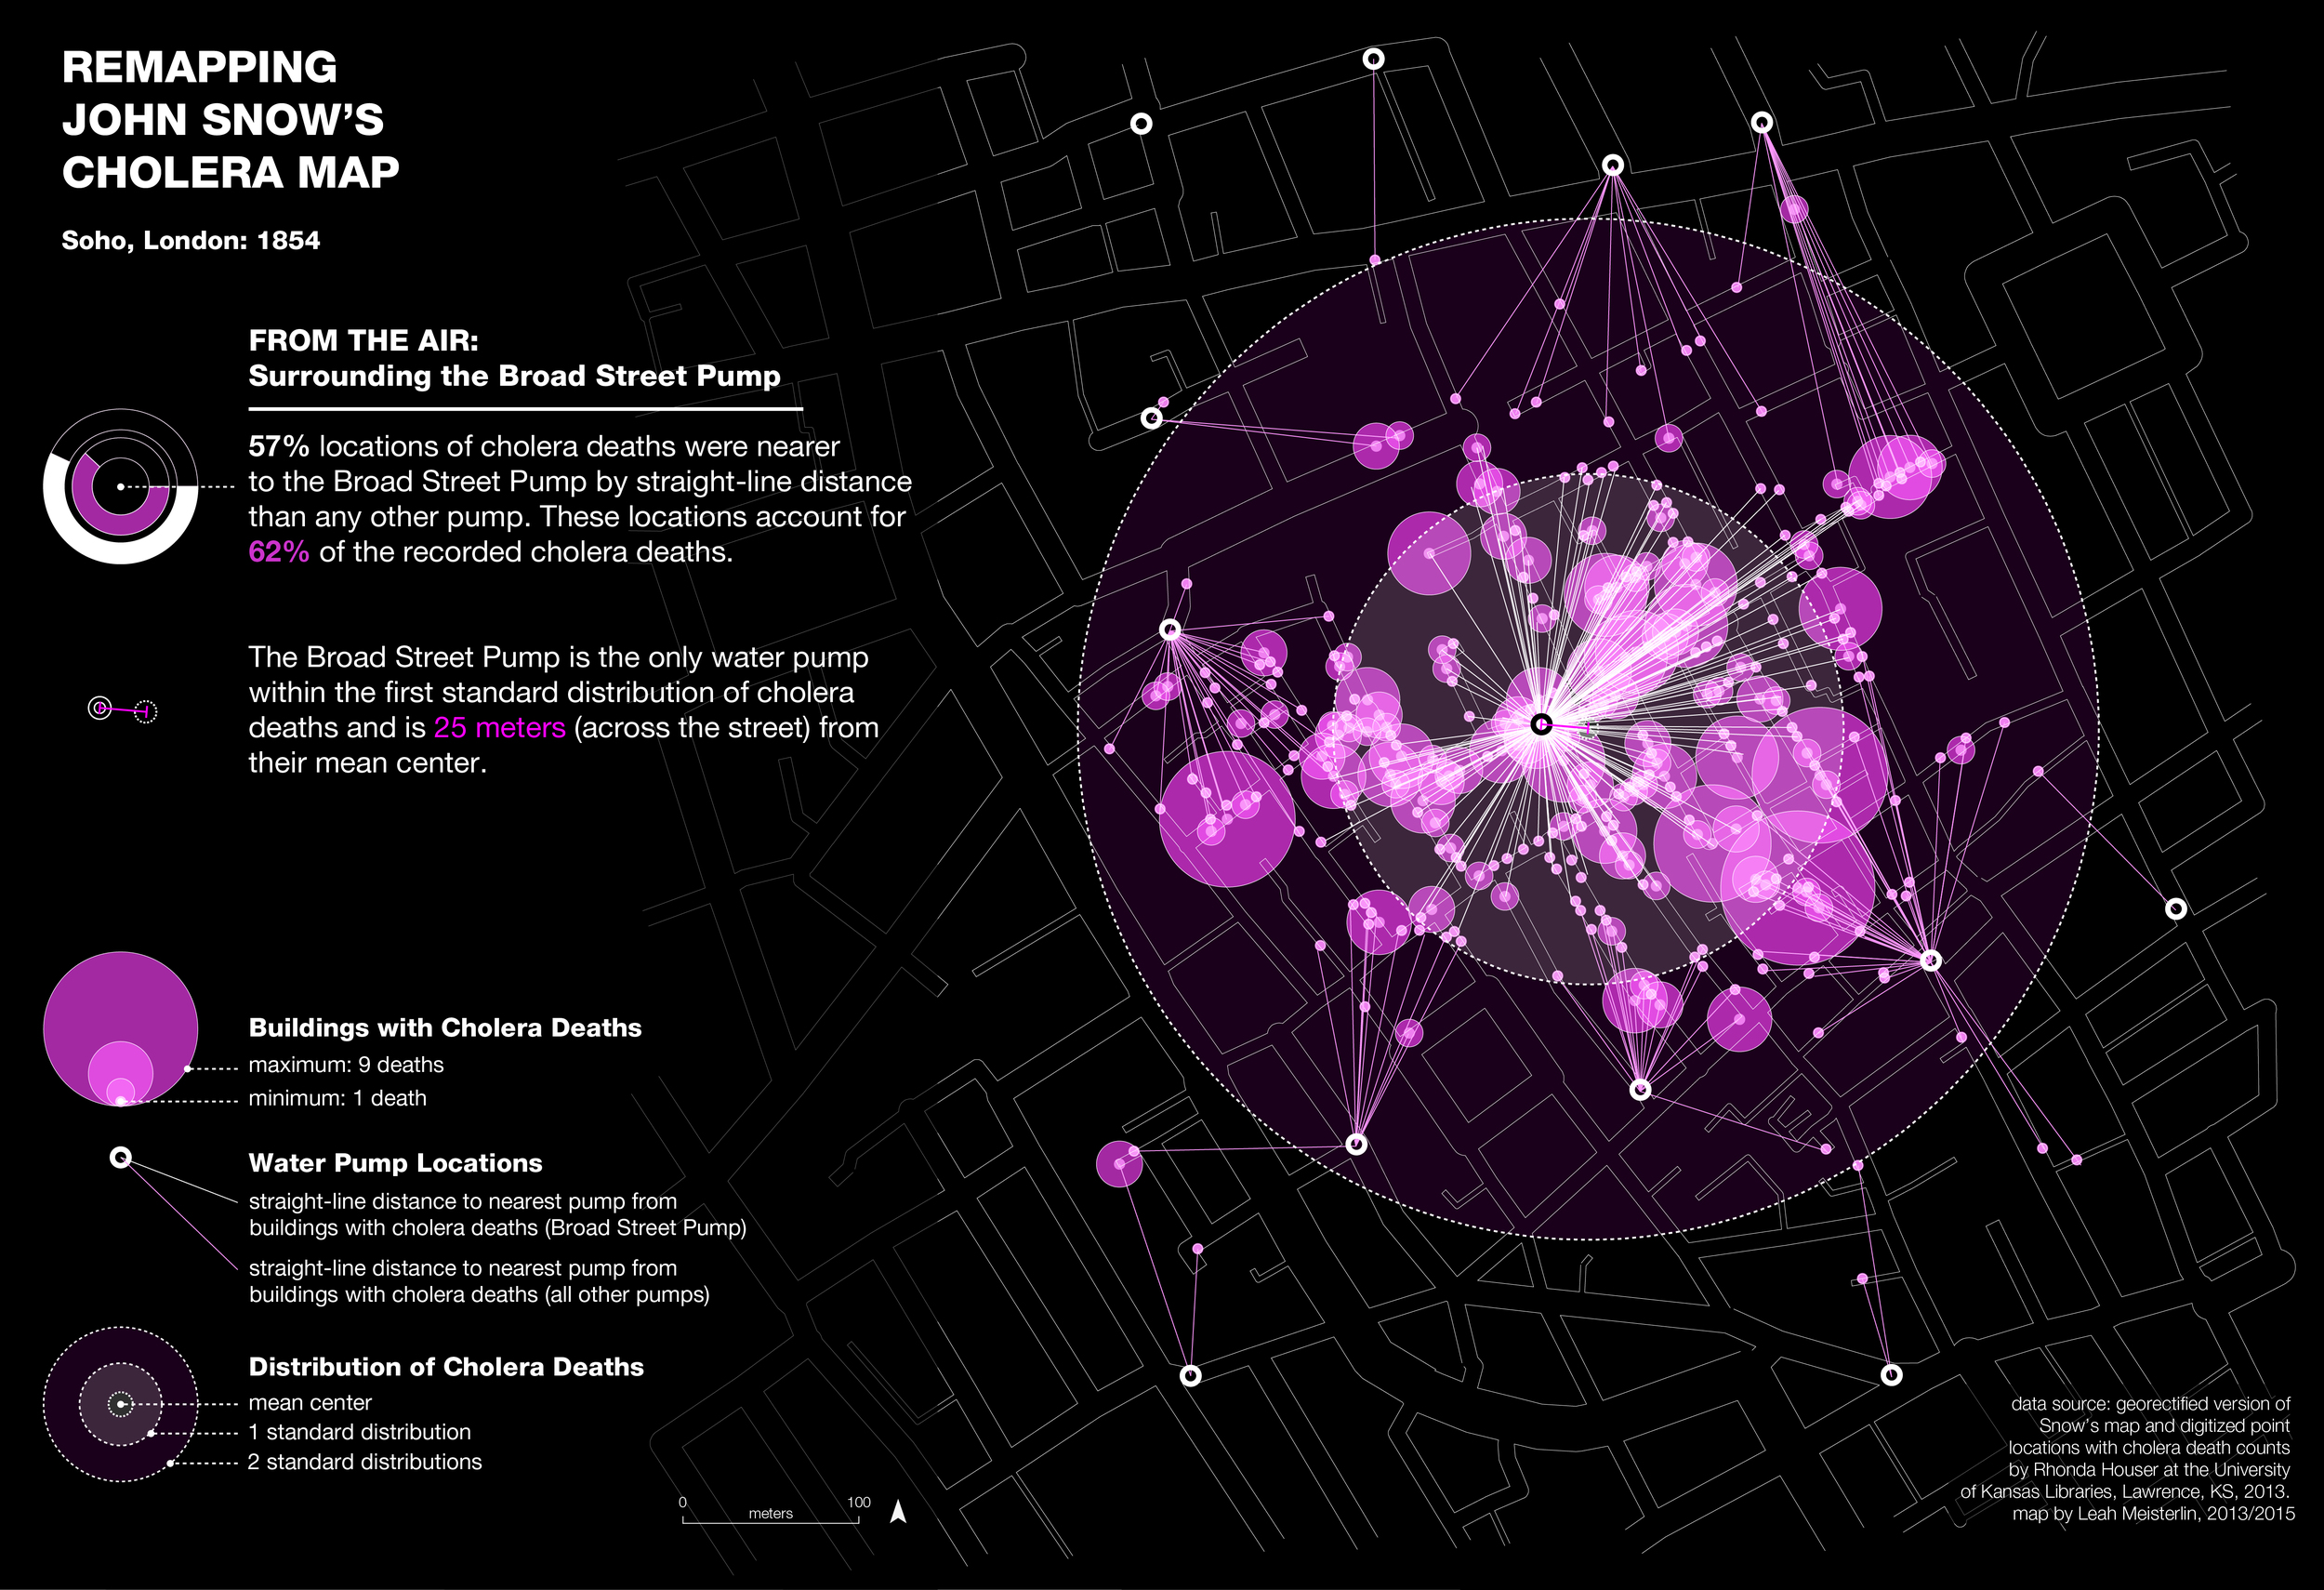
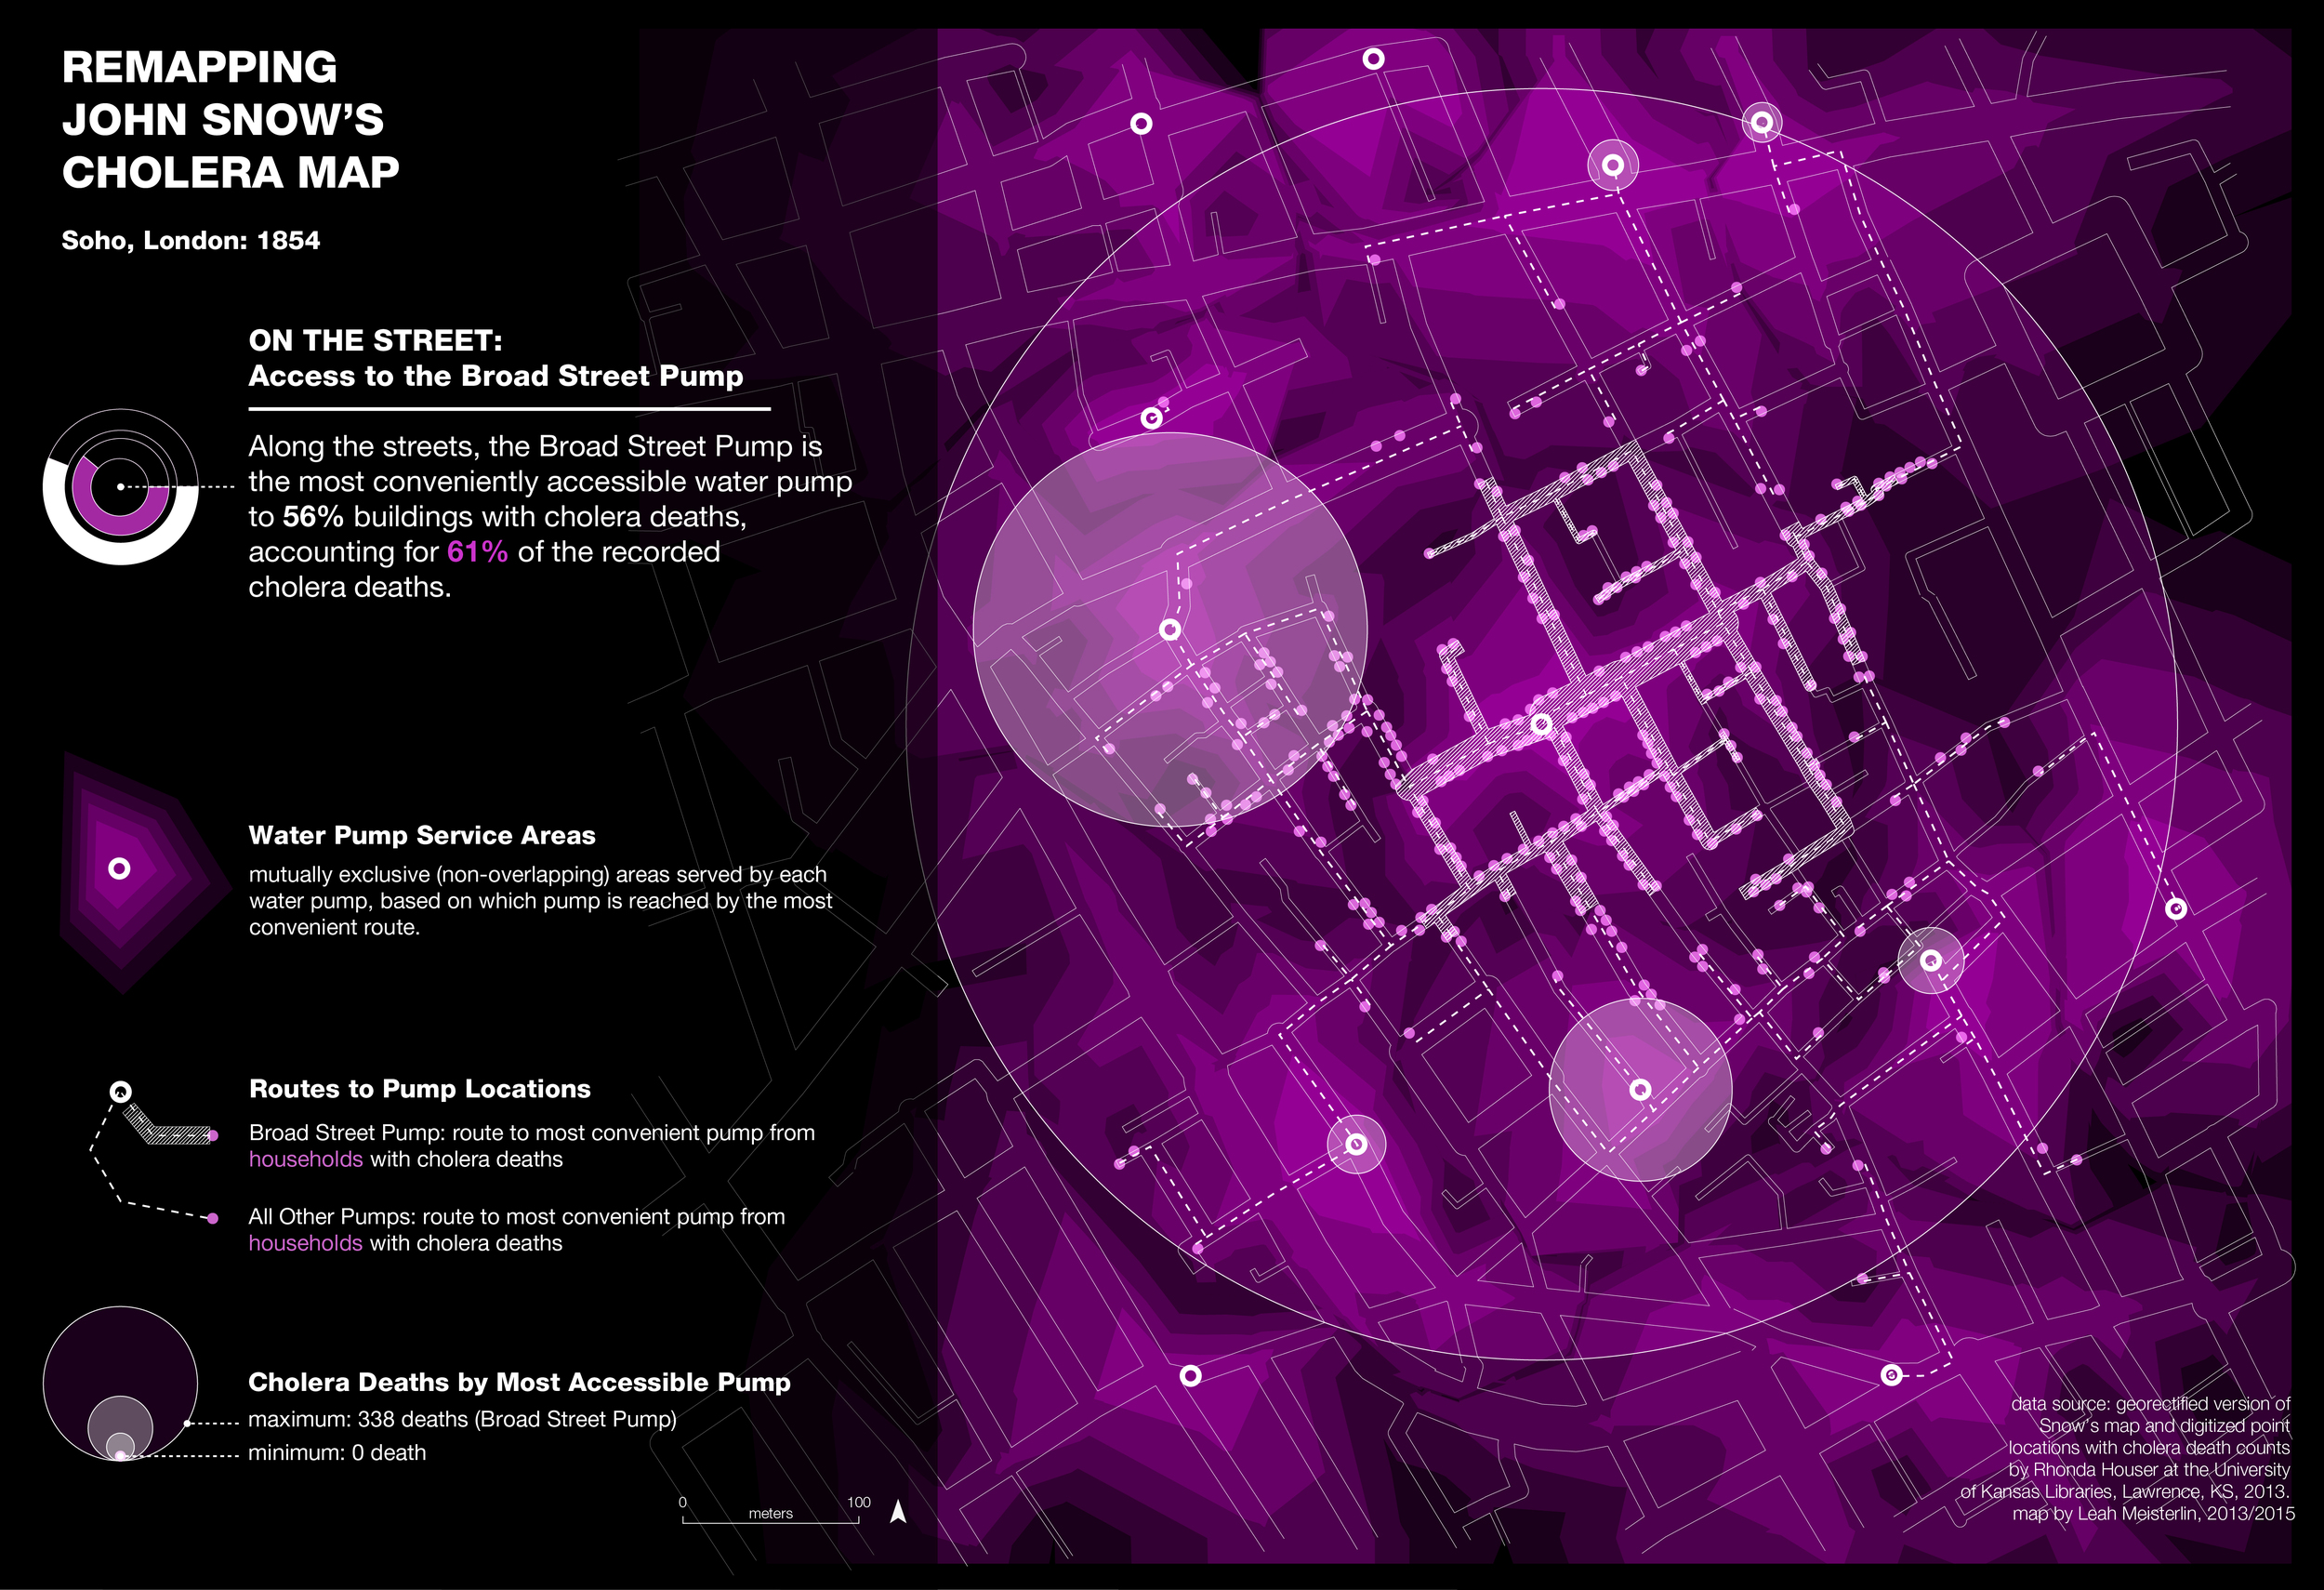
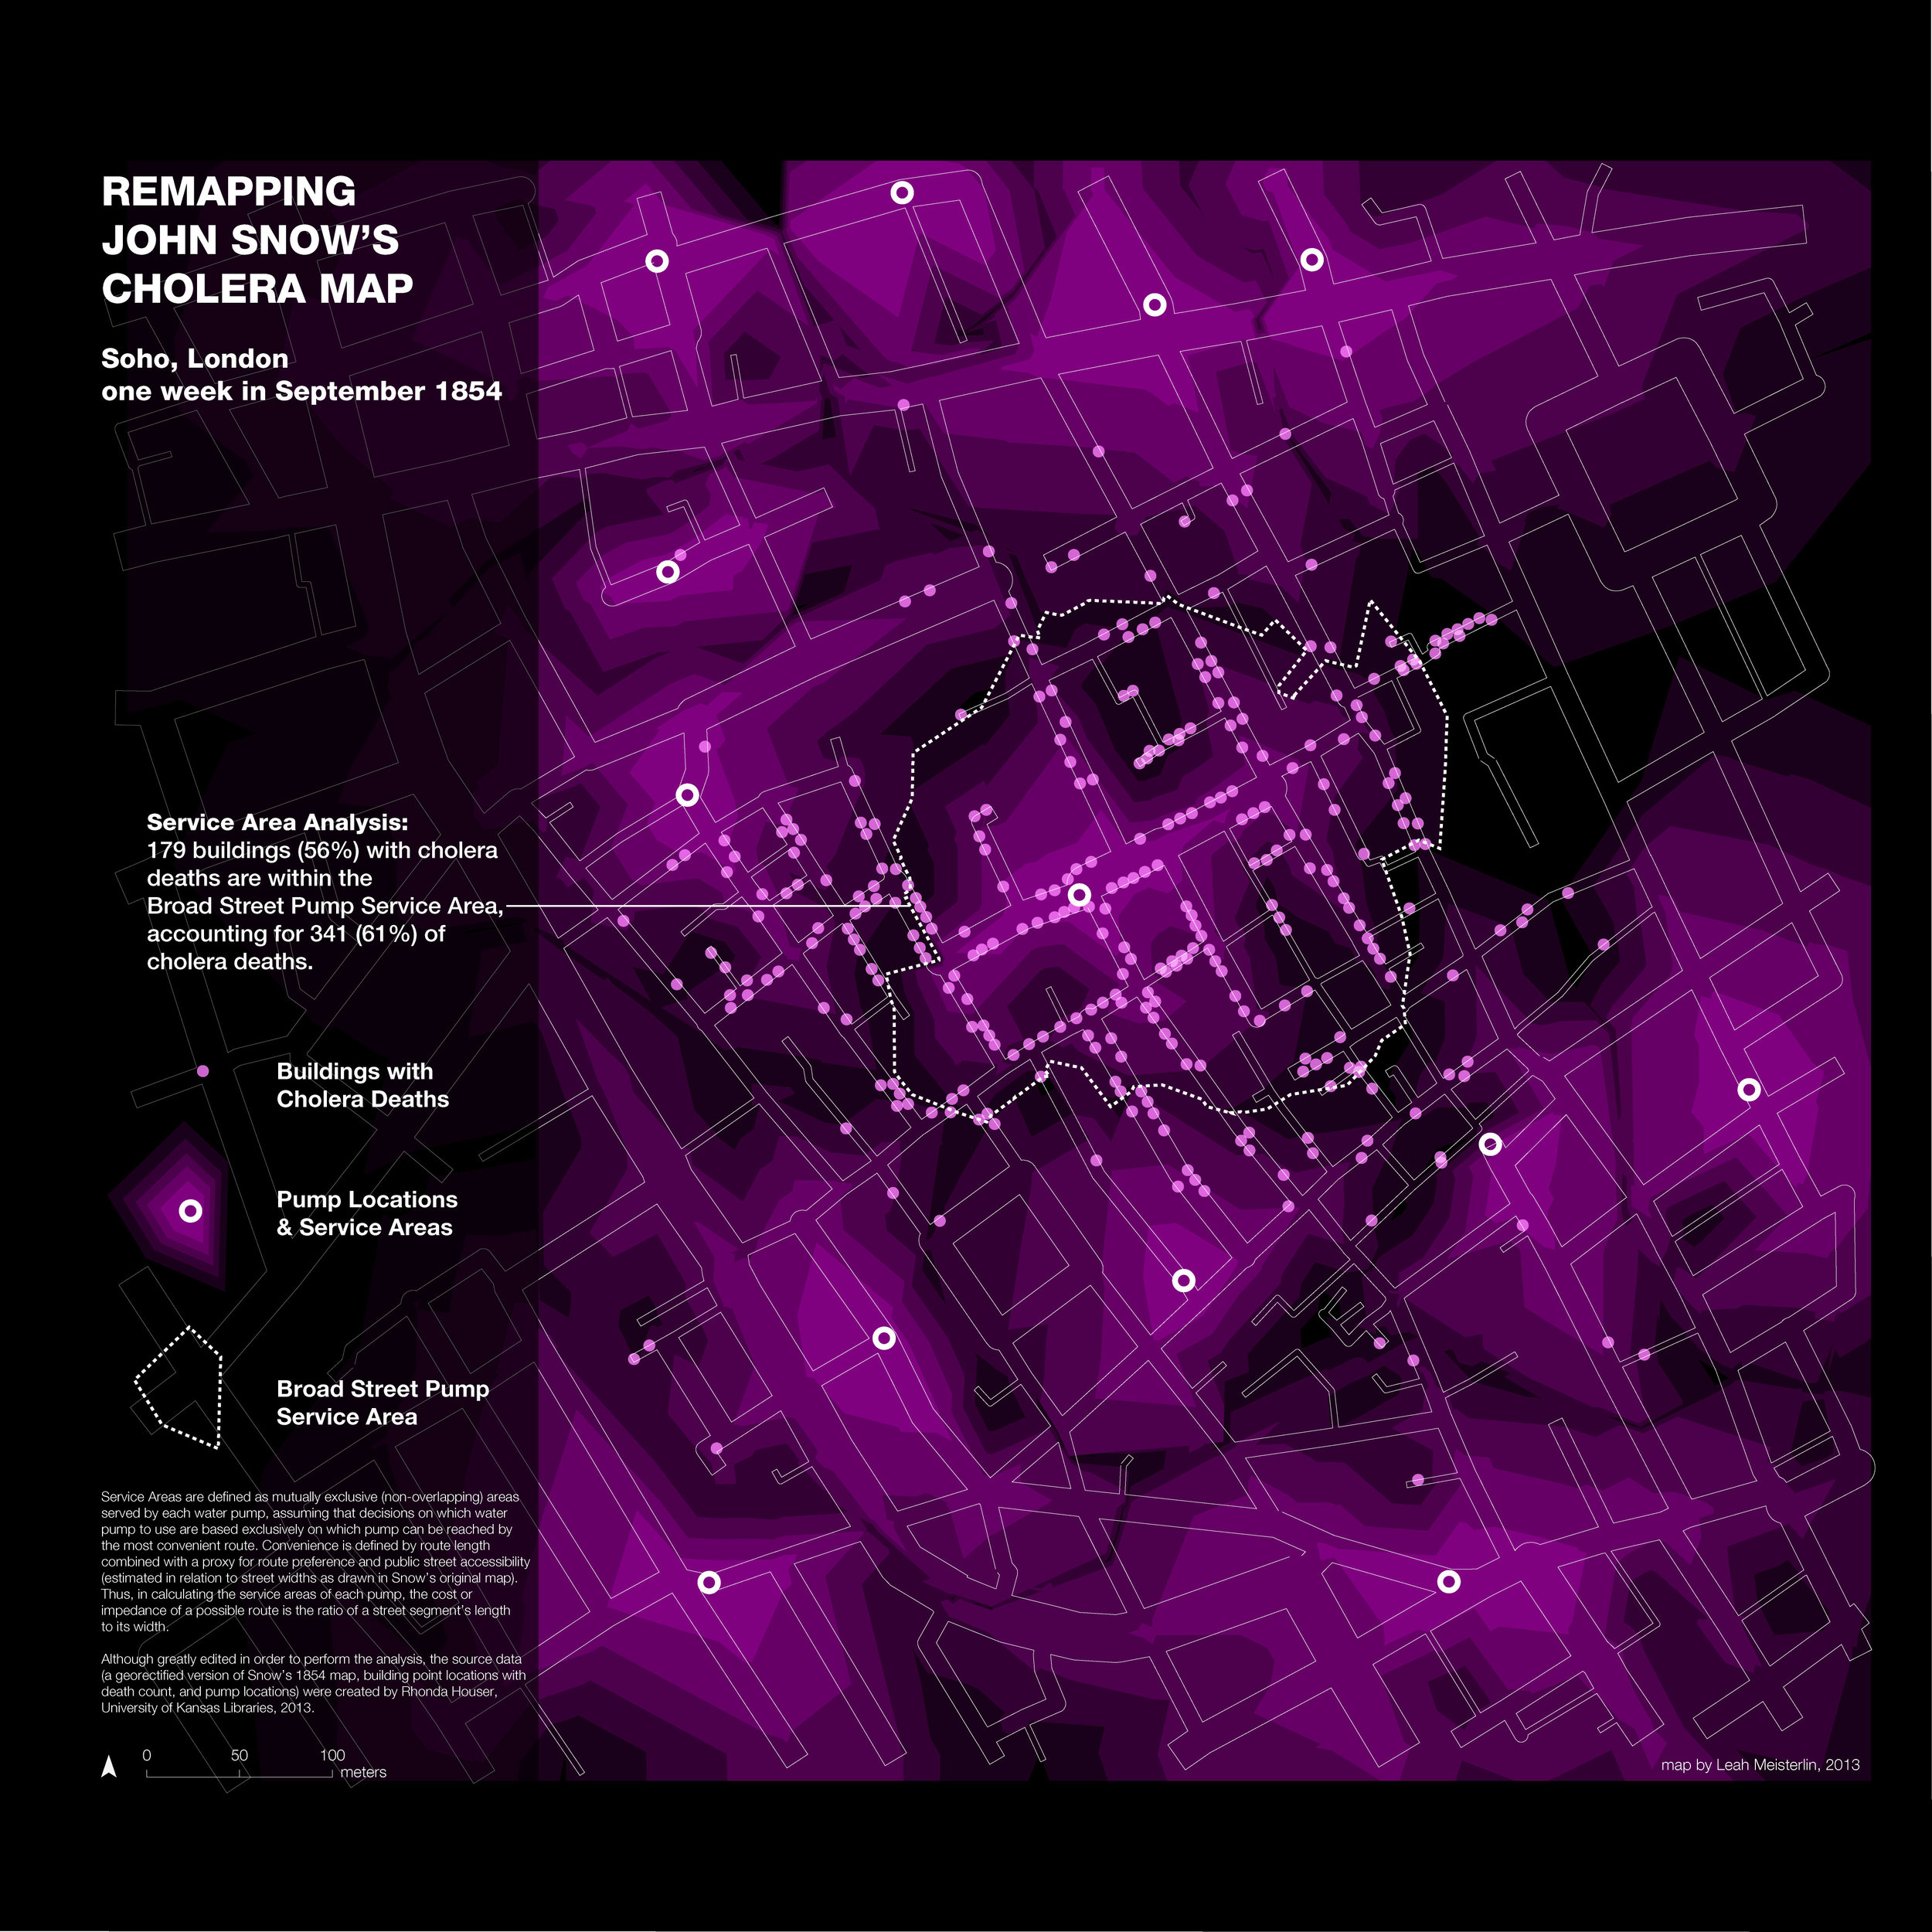
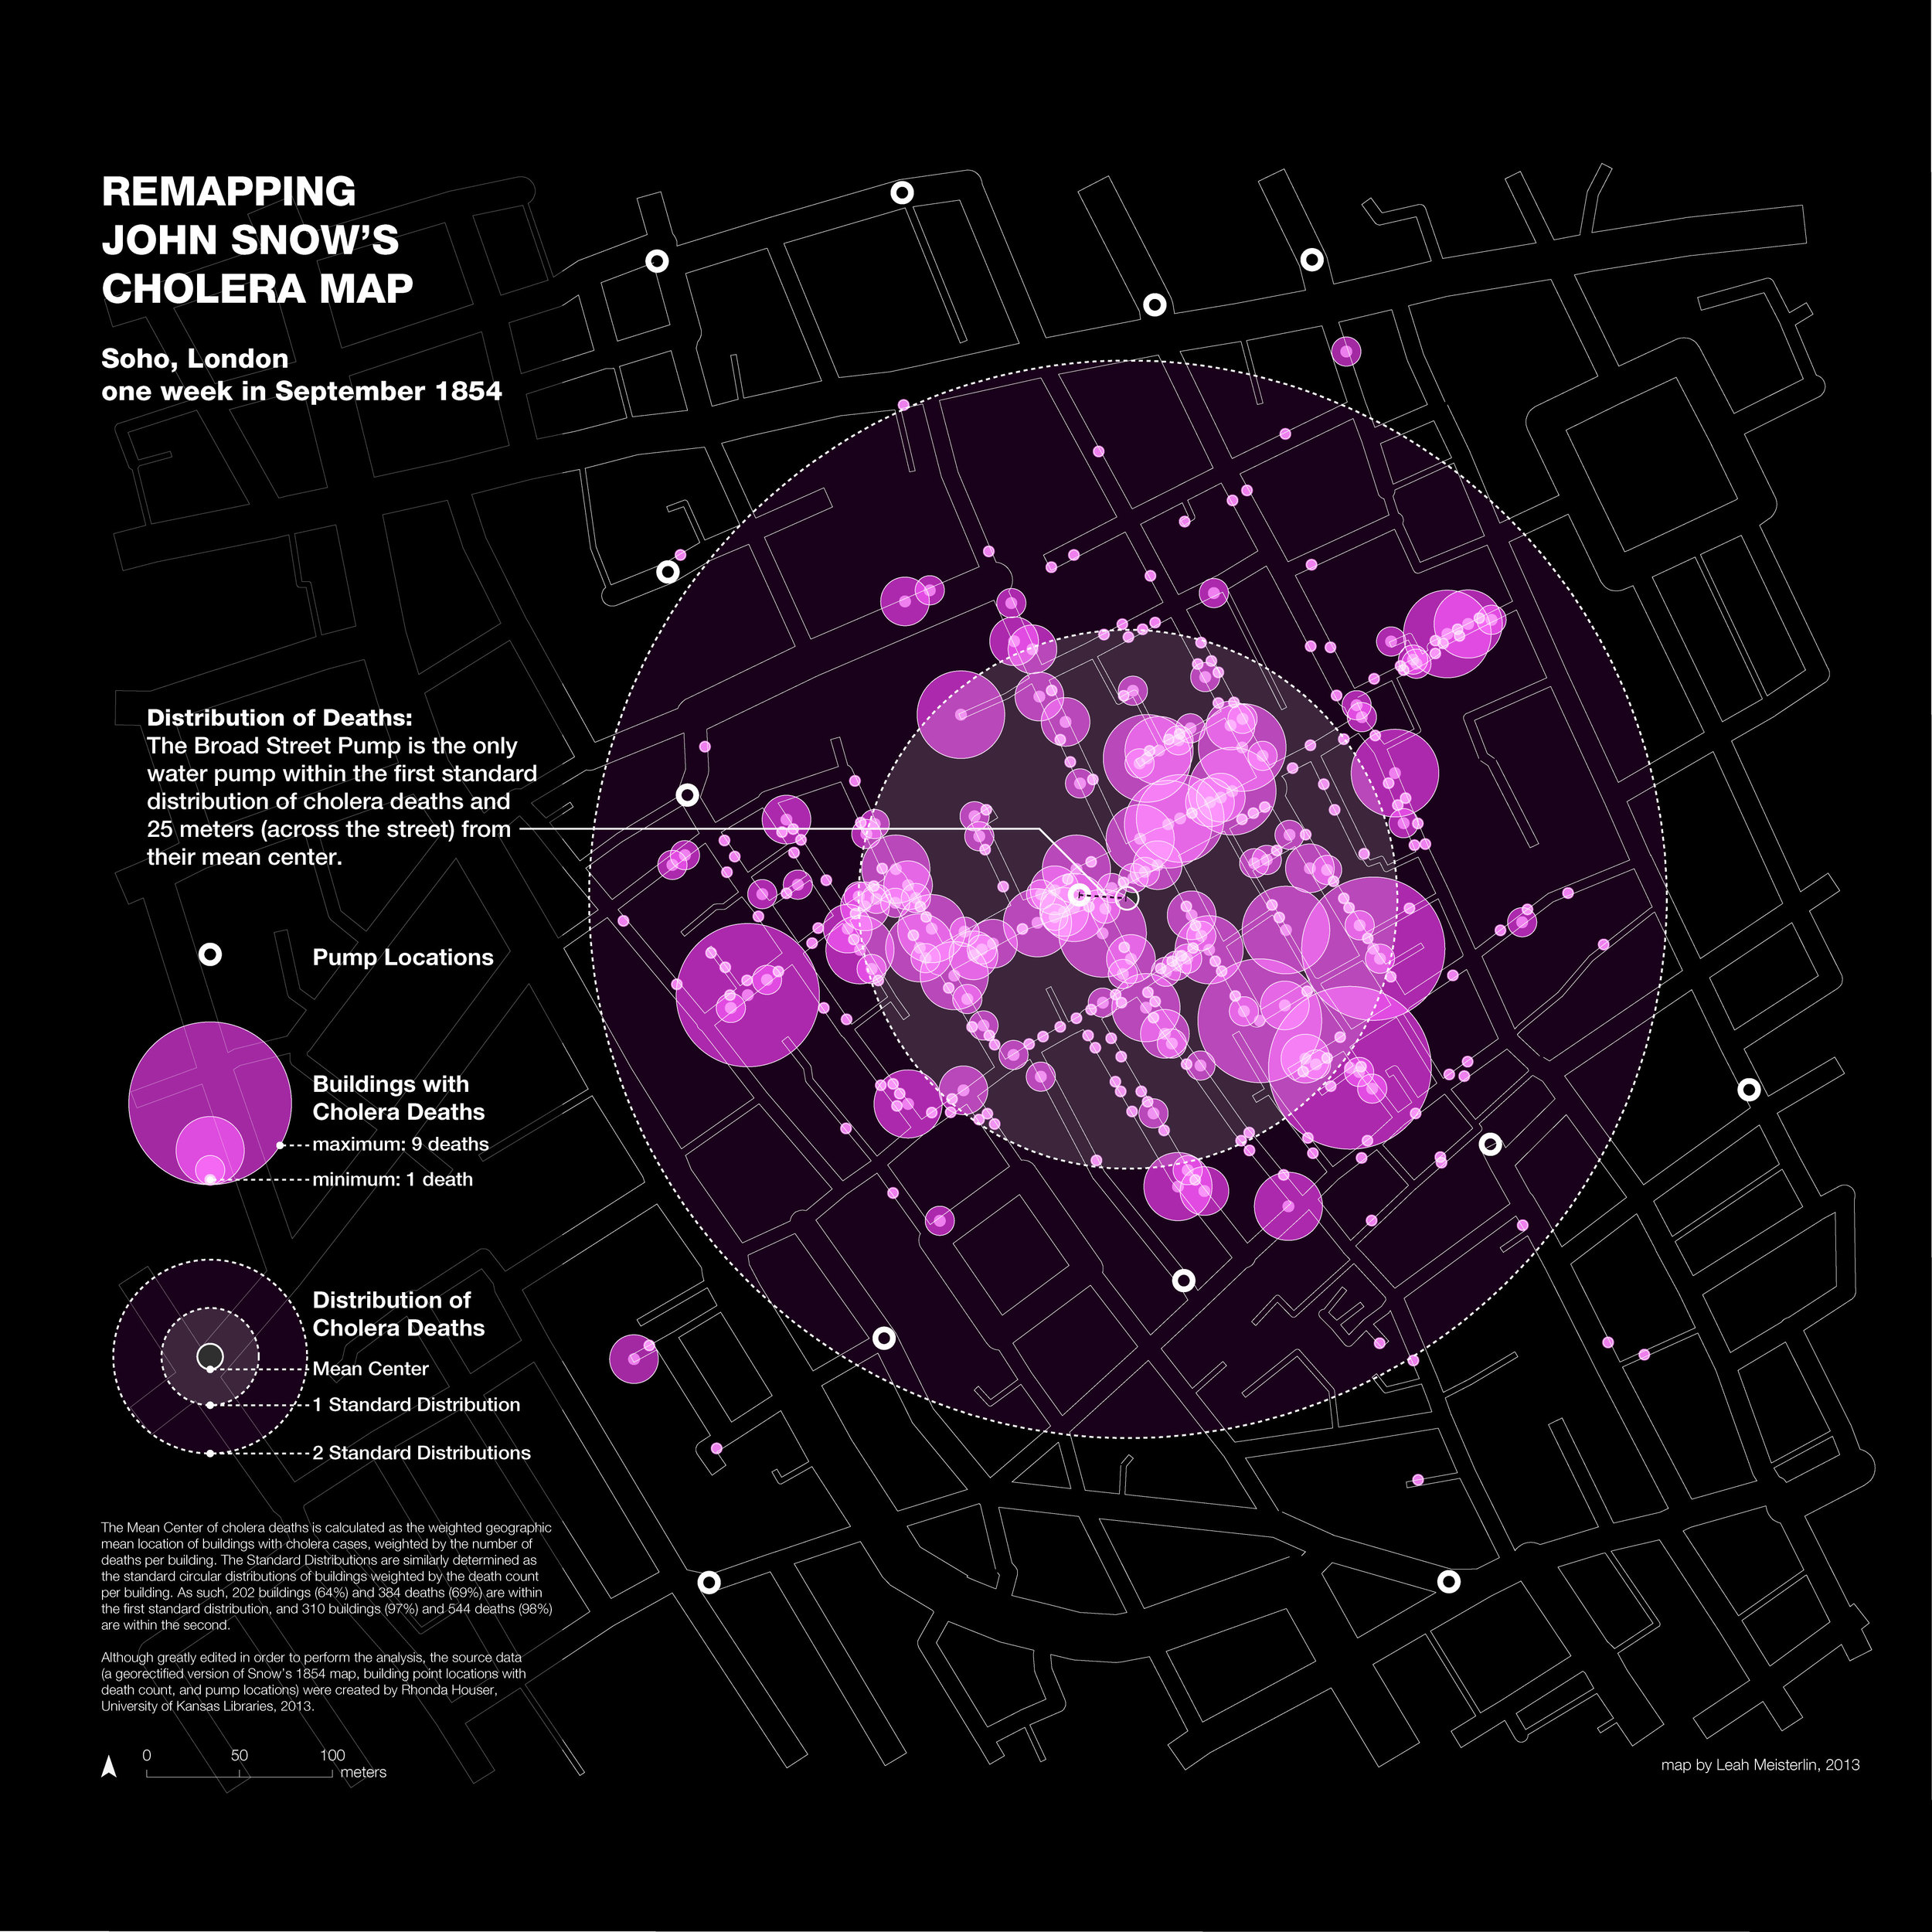
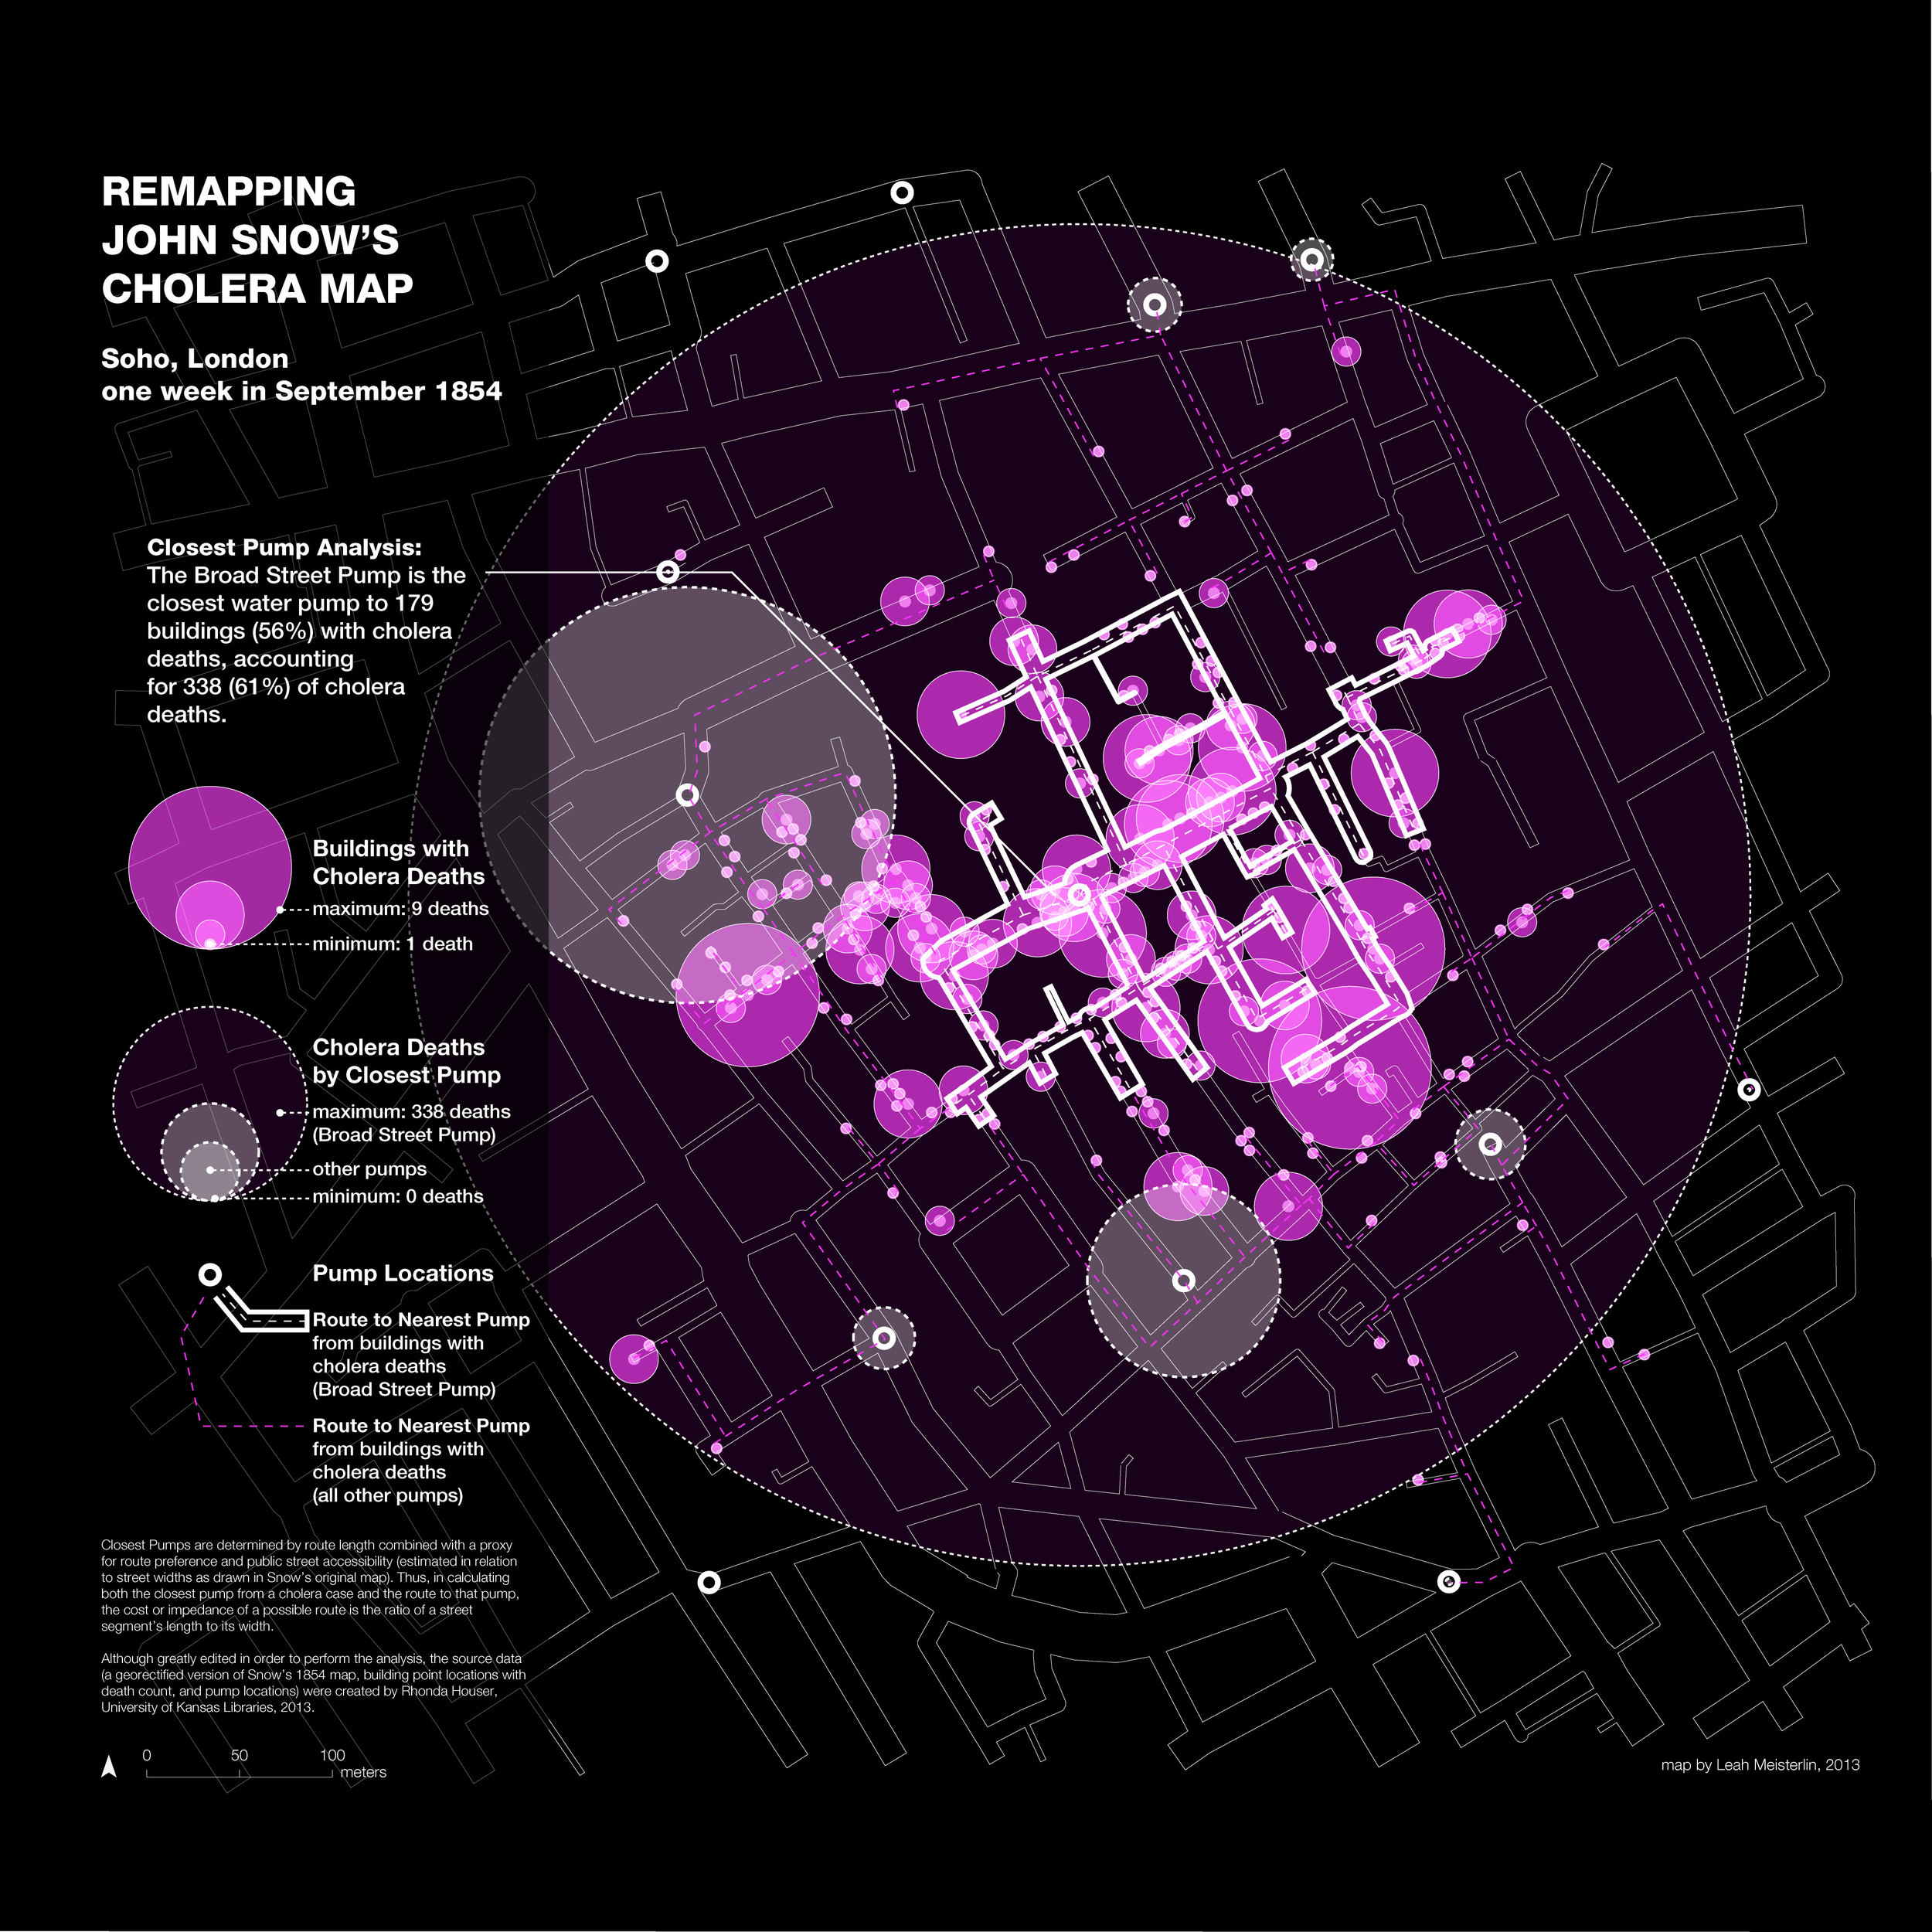
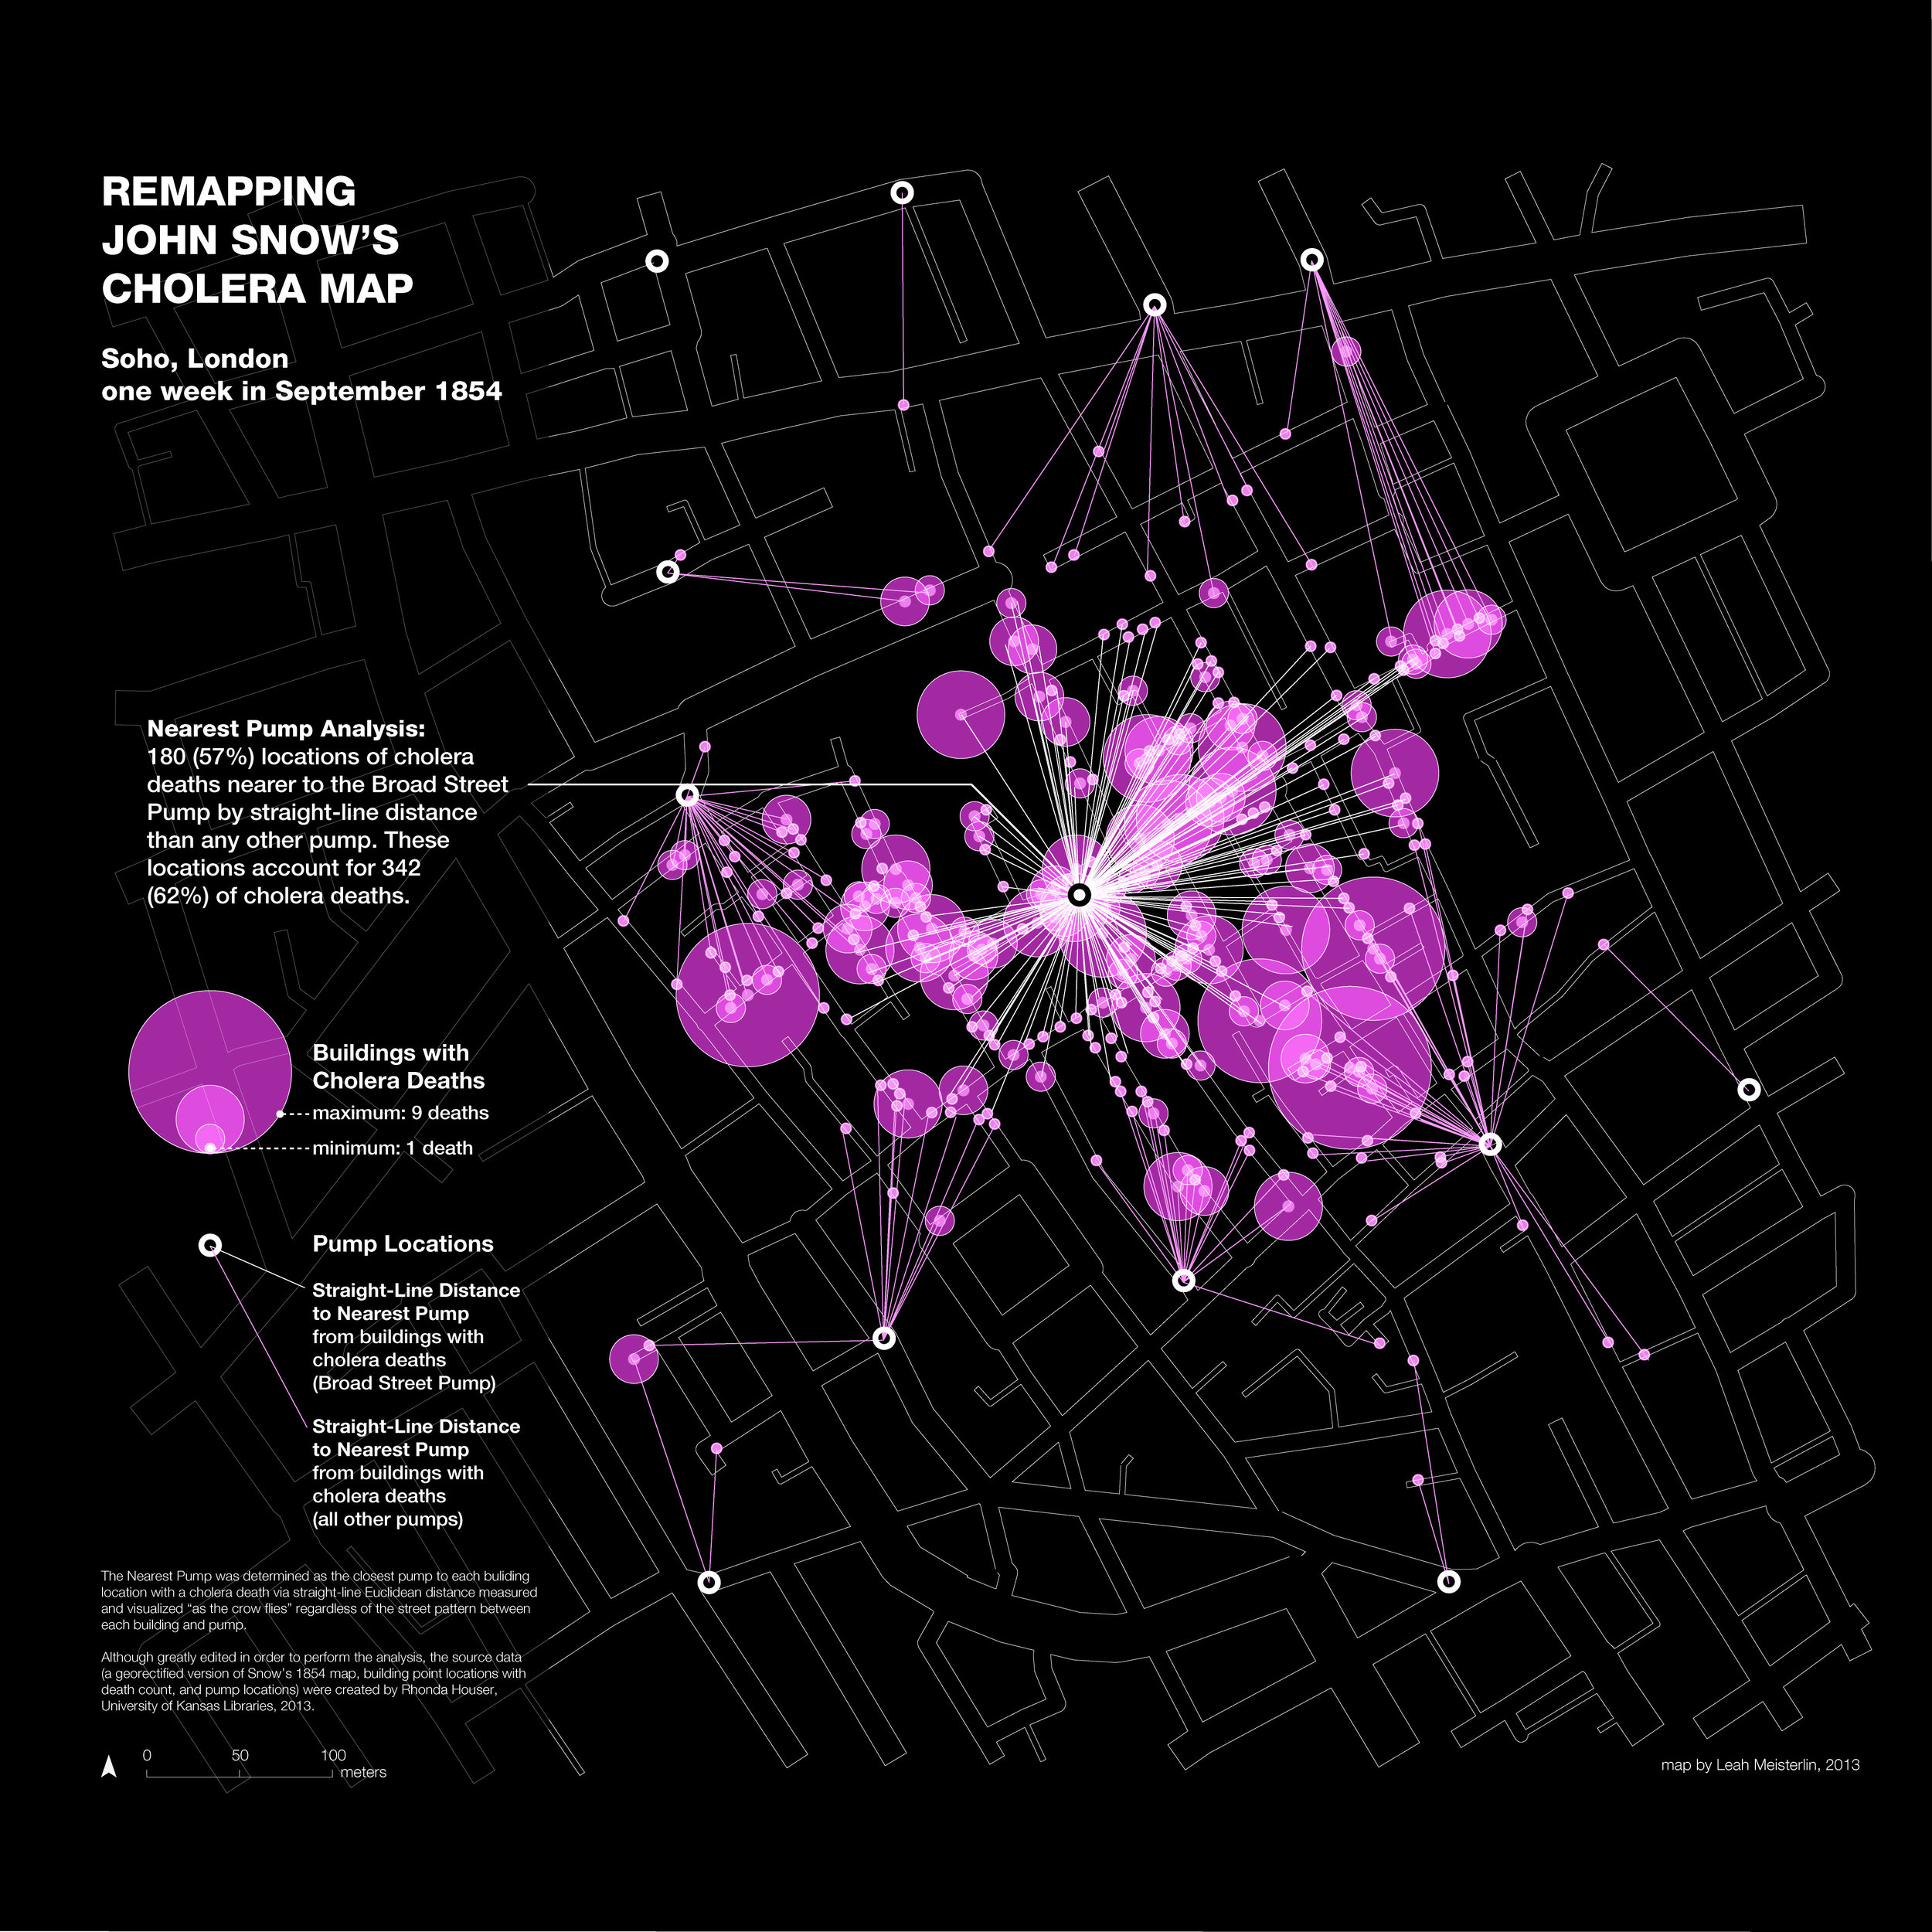
Remapping John Snow's Cholera Map
Soho, London. 1854
(2013)
14 inches x 14 inches (each)
Building on digitized data* created from the georectification of Snow's 1854 map, this series (four of five shown here) redraws and reanalyzes the cholera outbreak in Soho, London as originally recorded by the home location of deaths. The maps were originally created as teaching tools, demonstrating ways of mining "data" latent in historical visualizations of the city as well as methods of network analysis and spatial statistics.
*Data Source: Houser, Rhonda. 2013. John Snow Cholera Map as Rectified Raster Data, Water Pump Location Data, Deaths by Building Data, 2011 and 2013. University of Kansas Libraries.
the Redesign (for Urban Omnibus, 2015)
The four maps featured above were reworked and consolidated to describe two distinct methods of interpreting the urbanism surrounding the story of water pumps and cholera: looking at the data from the air and on the street. They were included in "Old Maps, New Tricks: Digital Archaeology in the 19th-Century City" (with Gergely Baics) on Urban Omnibus in June 2015.